Game 20 - Luis Castillo vs. Mother Nature
The Abominable Luis Castillo defeated the elements and the narrative.
Castillo pitched through a blizzard on Saturday and spun perhaps his best game of the new season. He threw seven scoreless innings, striking out eight batters with a 34% whiff rate. He walked one and gave up two hits, although one hit was a weak infield pop out that got lost in the snow flurries and dropped. It was a top 10 career performance by game score with a score of 83. And with just three hard hit balls allowed, it was a top three career performance by xwOBA at .150.
Castillo lowered his season FIP to 2.60 and is now tied for third in pitcher fWAR. He has a 29.3% strikeout rate (15th) and a 4.1% walk rate (10th).
The conditions for the game looked miserable. The grounds crew spent the afternoon clearing several inches of snow off the field. It started snowing again shortly thereafter and continued throughout the game. Players wore balaclavas and ski masks, and fans wore goggles and helmets. Fielders struggled to make routine plays on the frozen ground; base runners struggled to slide. Each huff and puff hung in the air like the pregame sausage and fireworks smog at T-Mobile Park.
With a first pitch temperature recorded at 33 degrees, it was the second coldest game in Mariners team history.
“It was cold, very cold,” Castillo told Ryan Divish after the game, “but when you’re doing something that you love, you don’t let stuff like that affect you.”
There’s a common talking point that Castillo pitches poorly in the cold, as highlighted by this tweet. Of course, you can find anybody saying anything at any time on the internet. But I’ve seen it brought up enough this season that I wanted to look into it more.
Does Castillo actually pitch worse in the cold?
The short answer is yes, Castillo has generally pitched worse in his career when it’s cold outside. But the longer answer is more complicated. The best I can tell, temperature has little to do with Castillo’s performance, and instead masks a more general early season trend.
Using the baseballr package, I pulled all of Castillo’s game logs prior to 2024 and merged them with game-level data related to weather conditions. I chose game score as the dependent variable to evaluate performance and rolled it over a three game average to reduce some of the noise within game score itself. (Note: I also ran everything with rolling FIP and got identical results—I just like game score better in this instance.1)
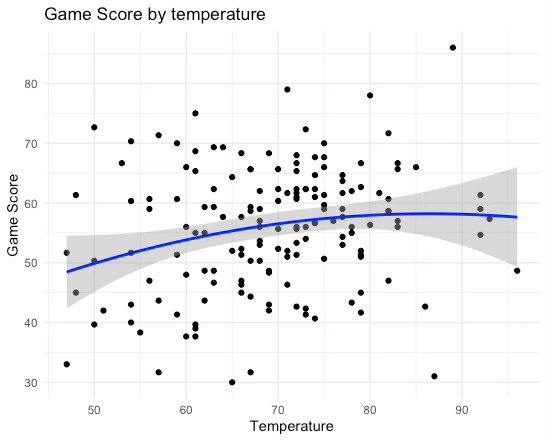
First, I looked at the effect of temperature alone (results ~ temp). With every one degree temperature goes up, Castillo’s game score goes up 0.2. That result is statistically significant, and the trend is clear when plotted.
But there are a variety of factors beyond temperature that might affect Castillo’s performance on any given day.
For instance, Castillo probably gets worse results against better teams. When incorporating the season wOBA of the opponent, the effect of temperature on results remained both directionally similar and statistically significant.
Castillo might also pitch worse to begin the season regardless of weather. In fact, there’s a statistically significant relationship when just looking at the outing number and game score.
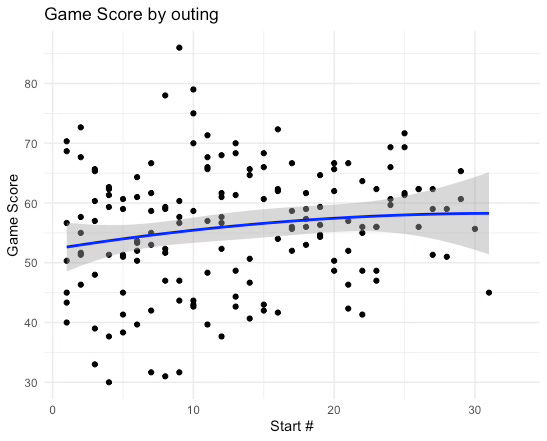
Castillo gets better throughout the year regardless of temperature. And since seasons typically begin cold and then get warmer, it’s necessary to separate temperature from the outing number to test its effect independently.
When incorporating both variables (results ~ temperature + game_rank + opp_woba), I found that temperature continued to show a statistically significant effect on performance. In this model, for every degree temperature gained, Castillo gained .18 points of game score. For example, his game score on an 80 degree day would be 5.4 points greater than on a 50 degree day because of the effect of temperature alone.
Now, temperature isn’t linear. Most people don’t feel 10% colder at 55 degrees compared to 60 degrees—they’re either cold or not cold. To capture this, I created a simple difference-in-differences framework with a binary variable where cold == 1 when temperature < 71 (the median temperature of Castillo’s career).
In warm games, Castillo’s game score is 4.1 points better than in cold games. That result is statistically significant as well when holding both the opponent and outing number constant.
To this point, all I’ve done is basically replicate what BrooksGate did in their ERA analysis linked above, albeit with a better metric and fancier tools.
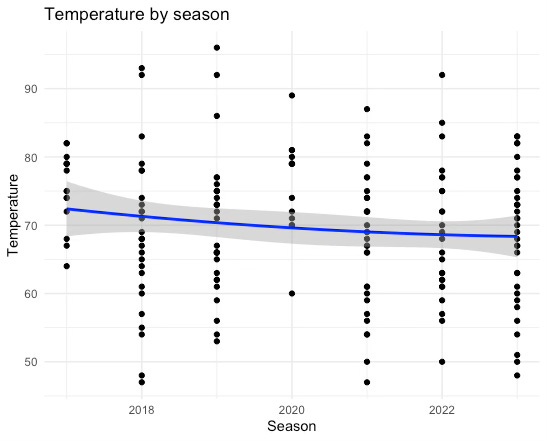
However, what these models crucially omit is a control for the season. There are a variety of things related to the season that might affect Castillo’s performance beyond just temperature—his age, his ability, the ball, the pitch clock, etc. And since temperature isn’t distributed evenly by season, it’s necessary to isolate its effect.
For instance, Castillo pitched in more cold games in 2018 than he did in 2020, and his FIP was nearly two runs worse. Is that discrepancy because of the temperature? Or because he was a different (worse) pitcher?
In both the temperature and D-in-D models, once I added fixed effects for the season and his team (Reds vs Mariners), and then clustered by season, any statistically significant relationship with weather disappeared. The results remained directionally similar, but it’s not possible to conclude that temperature independently affects Castillo’s performance.
I won’t send you home empty handed, however, as I did find one statistically significant result. Castillo’s average fastball velocity consistently and reliably goes up with each outing within a season (and then it tends to go back down towards the end).
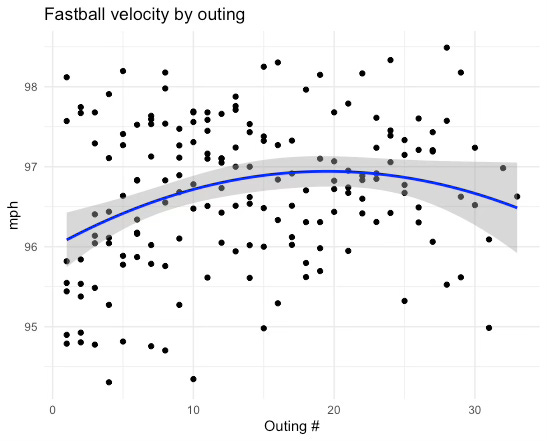
Notably, I found no evidence that his velocity is temperature dependent, though of course, Castillo on Saturday displayed his lowest fastball velocity of the season. It’s possible there’s some effect in the extremes.
There’s a lot I didn’t discuss here, and this is not meant to be rigorous analysis. There are a variety of other potential controls related to the venue, time of day, or even other weather factors like wind. It’s also important to understand Castillo’s performance by temperature relative to the league’s performance by temperature—i.e., sOPS+ for cold weather.
But for now, I feel safe in saying the temperature narrative is probably hollow, and perhaps masks a more general “early season” issue for Castillo. That’s not to say temperature doesn’t impact Castillo. It’s surely more difficult to grip the ball with numb fingers or keep a throwing arm loose—generally everything is more miserable when it’s cold. But that’s true for batters as well, who also deal with reduced exit velocities in colder temperatures.
Castillo’s next outing is scheduled for Thursday against the Rangers in the climate-controlled Globe Life Field. Maybe next time we can look at the effect of pitching in a big-box retail warehouse.
--
Game Score is my favorite stat for starting pitchers. No, it’s not as predictive or meaningful as FIP. But it’s a nice alternative that generalizes aspects of pitcher performance that FIP omits (and that people often incorrectly inject with ERA). Naysayers will say that pitchers don’t directly control hits or runs, which are both counted against the pitcher in Game Score. And while that’s true, the version of Game Score developed by Tom Tango heavily weights FIP components. The goal of a starting pitcher is to get as many outs as possible while limiting runs, and Game Score is the best, most elegant metric to capture that.