Game 31 - Core Score
Aggregated metrics are all the rage.
I wrote briefly about the Mariners performance on offense last Friday and how it stuck out by an assortment of numbers I like to look at. I have a few more thoughts.
Batting is decided by two things: approach and impact. That can be broken down further into four things: 1) what pitches does a batter swing at; 2) how often do they make contact; 3) how hard do they hit the ball; and 4) at what angles do they hit the ball. Good batters do some or all of these things well.
My goal is to find the single best metric to represent each skill and determine how much that skill influences production. Ideally, each metric will be simple, intuitive, and easy to glance at.
A few acknowledgements before I get started. The metrics below were coded and tested by me. It will be plainly obvious when I’m using an idea from someone else. There are a ton of people who do this type of analysis on the internet these days, and I read and pick up what I can.
The data comes from Baseball Savant. The main code to scrape the data comes from Bill Petti and the baseballr package. The rest of the work has been (slowly) developed by me over the last five years as I’ve improved in R. A long-term goal of mine is to make my workbooks publicly available.
Finally, the sample data includes all batter seasons between 2017 and 2023 with greater than 1,000 pitches seen. The regressions are clustered by season, and the only covariates are season dummy variables (except when I specifically mention additional covariates).
Heart Swing Index
Swinging at heart pitches is good. In fact, those are the only pitches a batter should swing at in most situations.
The heart swing index is created in a few easy steps. First, it takes the number of swings a batter made at pitches in the heart region and divides by total swings. This provides the heart swing ratio.1 Next, the heart swing ratio is divided by the rate of heart pitches seen.
This method neatly summarizes a lot of information. It tells us that a batter is swinging at heart pitches; it tells us that a batter is not swinging at pitches out of the zone; and it tells us that a batter is not watching heart pitches go by. I like to think of it as a batter’s overall commitment to the heart region.
For every standard deviation increase in the heart swing index, wOBA increases by .012.2 While the index has some effect on quality of contact (wOBAcon), the primary effect is seen on walk rate. For every standard deviation gained, walk rate goes up about 2.5%.
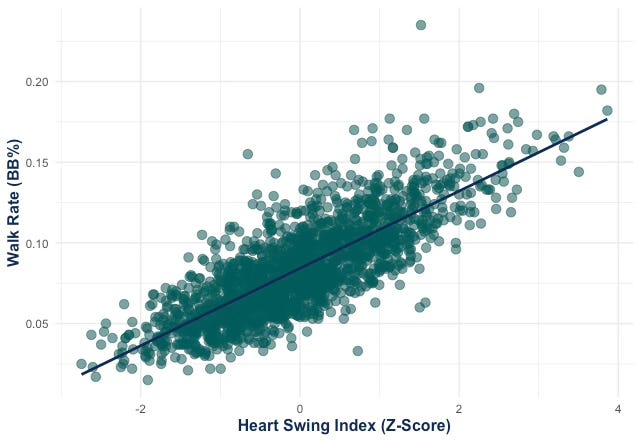
r^2 = 0.646; f-statistic 491.7 on 7 and 1886 DF
This is the skill I’ve spent the most time thinking about the last five years. I have a few thoughts about next steps.
One idea is to keep the structure the same but limit its scope to swing decisions in non-two-strike counts. If a batter runs a high whiff or called strike rate, they’ll likely find themselves in a disproportionate number of two-strike counts. And if their two-strike approach is different than their approach in other counts, then the heart swing index captures more than just commitment to the heart region.
The metric as constructed also doesn’t make the distinction between swings at borderline pitches and swings further out the zone. This is fine as a generalization but means it’s not fully representing player skill.
Another idea is to control for the count, leverage, and base-out state—i.e., does the batter make the right decision to swing or take for the situation. I worked on a project a few year’s ago (based on RE288) that measured swing decisions by count and location, and I’ve seen a few people attempt it since. I chose to abandon the framework, however, because 1) almost every situation boils down to swing at heart pitches and take otherwise (which is already captured by the index), and 2) it incorporates even more noise. Still, the Mariners are insistent on the count as the be-all and end-all, and it’s worth exploring further.
There’s also the matter of pitch type. I’ve generally been reluctant to incorporate pitch type because it doesn’t really change the fact that a batter should never swing out of the zone. Pitchers are also now more likely to throw their best pitch to any batter in any count, and it’s difficult to separate pitcher versus batter approach. I do wonder, though, if a batter can force a pitcher to throw a certain pitch by laying off everything else.
The heart swing index also assumes the normative, one-size-fits-all zone, rather than identifying unique power regions for each batter or pitcher (which seems to be the Mariners internal approach). The heart region likely captures most of a batter’s ideal swing location, but if a batter is adept at hitting the low fastball, should they still swing?
Whiff Rate
Whiff rate is simple and familiar—whiffs divided by swings.
Whiffs are bad because they’re strikes. But if you regress wOBA on whiff rate alone, the results suggest more whiffs lead to a higher wOBA. This is because players who whiff a lot tend to hit for more power. Once hard hit rate is added as a covariate, whiff rate shows a statistically significant and negative effect on wOBA. For every standard deviation gained in whiff rate (holding hard hit rate constant), wOBA goes down .011.3
Whiff rate has a clear effect on strikeouts. For every one percent whiff rate goes up, strikeout rate goes up about one percent as well.
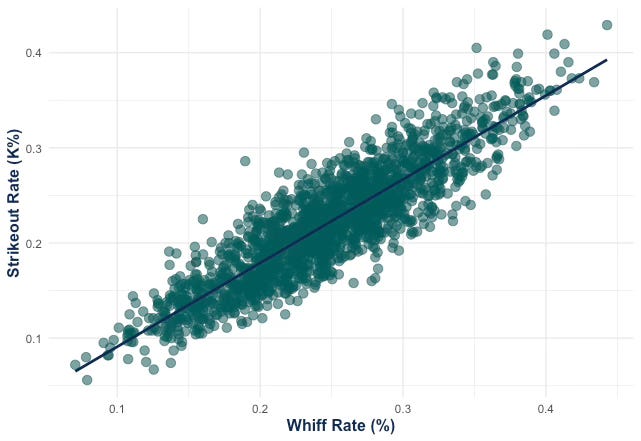
r^2 = .7896; f-statistic 1011 on 7 and 1886 DF
The metric I originally chose to evaluate contact ability was ball-in-play (BIP) rate on heart swings. This is an example of getting a bit too fancy. My initial thought was I’m not that interested in whether a batter whiffs on a pitch six inches out of the zone or rolls over—it’s a bad decision either way. But if a player is going to swing at pitch out of the heart region, they might as well make contact. A heart-focused approach to contact rate could be useful in an exclusively heart-focused tool, and that might be something to look into.
I also liked BIP rate over whiff rate initially with the thought that foul balls are still strikes. And I actually think that’s the right approach when looking just at the heart region—a heart foul ball is not only a strike but a missed opportunity. But foul balls can extend at bats in two strike counts, and sometimes those extended at bats turn into hits.
EV50
Exit velocity is the essential stat of contemporary baseball. The question is how do we package it in a meaningful way.
To paraphrase Tom Tango, the issue is all batted balls below about 90 mph return similar results. It doesn’t matter whether a ball is hit 57 mph or 87 mph, it’s probably going to turn into an out, and it’s certainly not going to turn into a home run. That’s why average exit velocity can generally be discarded. It treats a 60 mph and 110 mph batted ball the same as two 85 mph batted balls, even though a batter is far more likely to reach base in the first scenario.
Savant tries to address this with hard hit rate, or the percent of batted balls hit harder than 95 mph (the importance of this threshold is shown below). But hard hit rate treats all hard hits the same, whether that’s 95 mph or 110 mph.
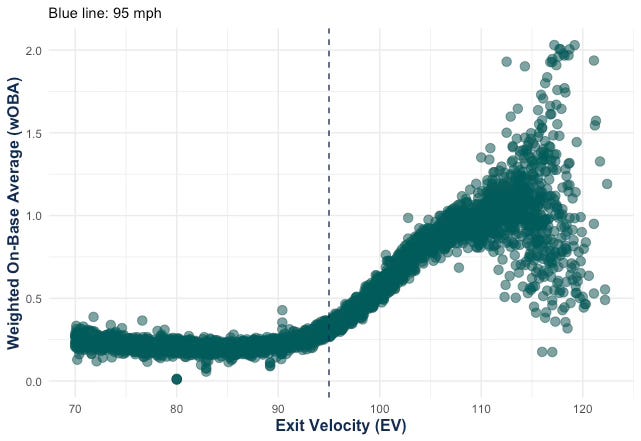
That’s where EV50 comes in—one of two methods Tango proposed to address this issue. It sorts a player’s batted balls by exit velocity and takes the average of the hardest 50%, or everything above the median.
EV50 allows us to lop off a batter’s weakest batted balls, with the premise that poor contact is poor contact regardless of how poor. And it allows us to distinguish between players who hit the ball hard versus players who hit the ball very hard.
EV50 has a strong effect on quality of contact. For every standard deviation gained, wOBAcon goes up .046.4
Launch Angle wOBA
Launch angle is similar to exit velocity in that its relationship to wOBA is not linear. An average won’t work.
Savant addresses this with sweet spot rate. The “sweet spot” is defined as the area between 8 and 32 degrees—the angles that produce most hits and extra base hits.
But this treats all balls outside the sweet spot the same (the inverse issue as hard hit rate). The graph below shows how wOBA slowly ramps up below the sweet spot, and then immediately dives above the sweet spot.
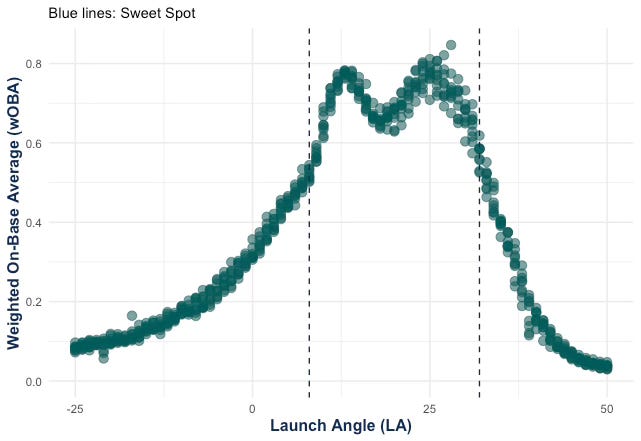
This is because grounders are often hits, while high fly balls and pop ups are usually outs. For instance, a miss of 8 degrees below the sweet spot results in a .332 batting average, while a miss of 8 degrees above the sweet spot results in a .109 batting average.
To address this, I binned launch angle at every four degrees and found the average wOBA for each bin. Every batted ball is then assigned the average wOBA for that bin, regardless of its other properties. In a way, this creates an EV-neutral launch angle score.
Launch angle wOBA isn’t perfect, and it represents only a slight improvement over sweet spot rate in the model.5 It’s possible this method overvalues batters who hit lots of grounders, but directionally, I think this is the right approach.
Ideally, a batter would fit his launch angle to his exit velocity. One idea could be to use Tango’s escape velocity metric to classify players by their exit velocity capabilities and identify their ideal launch range—a personalized sweet spot rate. This approach could even layer in the launch angle wOBA structure to distinguish better angles within a batter’s ideal range.
CoreScore
Let’s put these together.
First we need to put them on the same scale. That’s easy enough—we just need to take the z-score of each metric for each player. Once we have four z-scores, we can add them together into a single number. We’ll call this CoreScore for now.6 For every standard deviation increase CoreScore, wOBA increases by .017.7
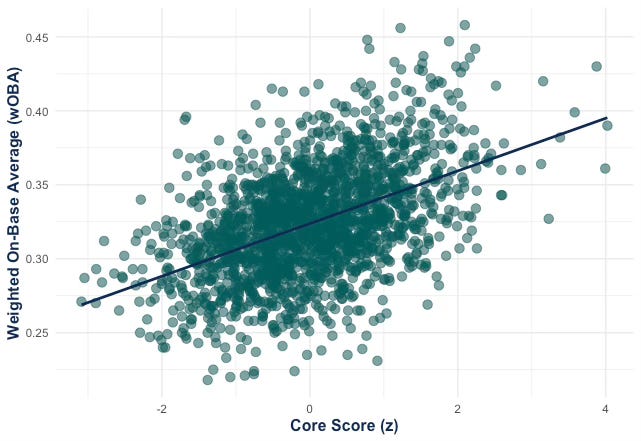
r^2 = .2481; f-statistic 88.89 on 7 and 1886 DF
Now, some of these metrics have a larger effect on wOBA than others. To account for this, we regress wOBA on all four metrics to create linear weights. Here are the coefficients:
Heart Swing Index .007
Whiff Rate .0118
LA wOBA .011
EV50 .024
Under the weighted model, for each standard deviation gained, wOBA goes up .025.9
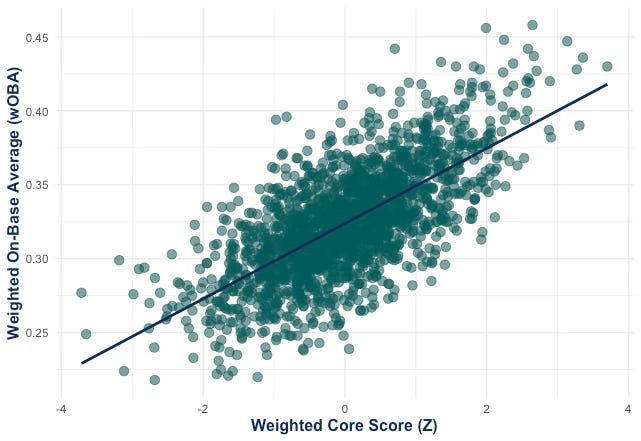
r^2 = .4926; f-statistic = 261.6 on 7 and 1886 DF
The components of CoreScore individually identify walks, strikeouts, and quality of contact. And as a whole, there’s a reasonable relationship with wOBA. I think it’s a useful entry point to explore the essentials of hitting.
I’ll wrap this up by saying none of this is meant to be predictive. The goal here is not to say whether a player is going to be good or bad in the future based on their CoreScore; the goal is to better describe why a player was good or bad in a given period.
More than anything, this post represents my current approach to evaluating batters. I will be returning to this throughout the season.
The heart swing ratio is different from heart swing rate, which looks at how often a batter swings at a pitch in the heart region.
p-value < .001; t-value = 17.789; r^2 = .1433; f-statistic = 45.07 on 7 and 1886 DF
p-value < .001; t-value = -18.365; r^2 = .3859; f-statistic = 148.1 on 8 and 1886 DF
p-value < .001; t-value = 42.3779; r^2 = .6827; f-statistic = 579.6 on 7 and 1886 DF
There’s also the issue of the relationship between exit velocity and launch angle. The effect of one on wOBA depends on the other, and both likely influence each other. But I’d like to keep them separate for this model.
I’m not really attached to the name CoreScore. It sounds nice but the shorthand CS is already taken by called strikes, and CoreWAR is an independent and ongoing development from Tango. But if there’s anything I hate about blogging, it’s naming things, and I refuse to spend more time on it. When I initially coded this in R, I actually called it the Dipoto Coefficient, because I had this great theory that the essential components of Jake Lamb could predict every Dipoto acquisition. Maybe I should have called it LambScore.
p-value <.001; t-value = 27.0640; r^2 = .2481; f-statistic = 88.89 on 7 and 1886 DF
Note: I’m using a higher standard deviation to equal a “better” or lower whiff rate. It works in either direction, but it’s easier to interpret this way.
p-value <.001; t-value = 41.9862; r^2 = .4926; f-statistic =