T-Mobile Park, factored
The sunset could create about 100 extra strikeouts and more each year in Seattle.
Park factors are simply a comparison of home and road performance. We expect these to be about the same over a large enough sample. When they aren’t, we assume the stadium—the most notable variable—is creating that difference, especially at the extremes.
For instance, the park factor at Coors Field is 112, which is very high. This makes sense both because Denver’s low air density allows the ball to carry further, and because the outfield is made larger to compensate. We expect Rockies home games to have more hits than Rockies road games, and we see that in the data. For most stadiums with batted ball phenomena, we can come up with a similarly clean narrative.
What we don’t have are a clean narrative for why some stadiums, like T-Mobile Park, seem to create extra strikeouts.
Stadiums look different. They’re built with different dimensions, colors, and materials. Given that batter vision is so crucial and the margin for error is so narrow, it’s likely some backdrops are better than others for picking up a ball moving 100 mph.
How can we be sure these innate, visual differences matter?
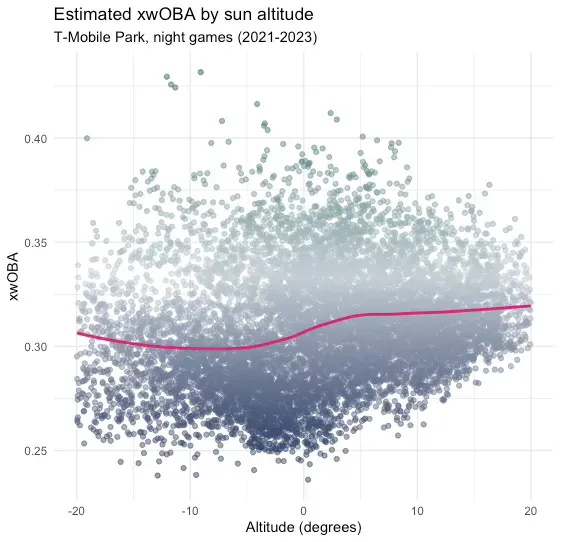
In August, I showed the probability of a whiff changes with the position of the sun at T-Mobile Park. A swing is at least 10% more likely to be a whiff just after sunset than just before. In this model, the position of the sun represents different backdrops within a stadium. By comparing a stadium to itself, the model removes potential confounders that exist between stadiums, isolating the effect of light itself. A change in performance with the setting sun allows us to say, yes, the way the stadium looks matters.
How much can it matter?
Strikeouts, factored
The math behind park factors is simple enough. You can make a few adjustments if you want, but the basics are:
- 100 * [home stat rate / road stat rate] = park factor
The further from 100, the larger the split, and the stronger the implication against the stadium.
The Mariners combined strikeout rate at home from 2021 to 2023 was 24.9%. Their combined strikeout rate on the road was 22.8%. So if we put that in our formula (along with a few other useful stats):
100 * [.249 / .228] = 109 strikeout factor
100 * [.295 / .319] = 92 wOBA
100 * [.351 / .374] = 94 wOBA(con)
100 * [.302 / .323] = 93 xwOBA
100 * [.362 / .379] = 95 xwOBA(con)
Let’s start with the strikeouts.
If we assume the pre-sunset whiff rate (~25.1%) from the original post is the true whiff rate for T-Mobile Park, we come up with about 230 extra whiffs each year. Whiffs and strikeouts are strongly correlated, and there are about 2.1 whiffs per strikeout league wide. If you divide 230 whiffs by 2.1, you get 109 additional strikeouts. On average, there are 5,974 plate appearances per season in Seattle and 1,487 strikeouts. So if we subtract 109 strikeouts, T-Mobile Park’s strikeout rate drops from 24.9% to 23.1%.
Is that sound logic?
Well, we can get to a similar answer another way. Strikeouts also seem to be a function of the sun. The odds of a strikeout jump at least 10% after sunset. Here is the result from the GLMM:
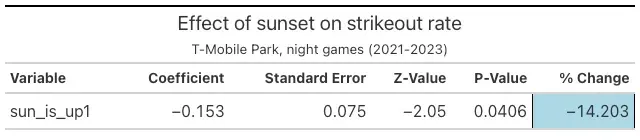
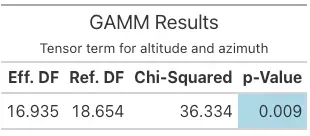
And the result for the position of the sun in the GAMM:
NOTE: The premise and the models are outlined in the original post; the main change I’ve made since is to incorporate weather data. This post is meant to illustrate the potential scope of the issue, and how we might think about this effect in terms of park factors. I got some good questions after publishing originally that made me think harder about the model. So if you’re seeing this after 10/23/24, the coefficients are bit different. I created a Git repository where you can find the pitch, weather and sun data for 10 stadiums from 2021 to 2023 (as well as the .R file where my models are detailed). Please reach out with any questions or feedback, even if it’s to tell me to stop staring at the sun.
Here is the estimated strikeout rate for each stage of sunset:
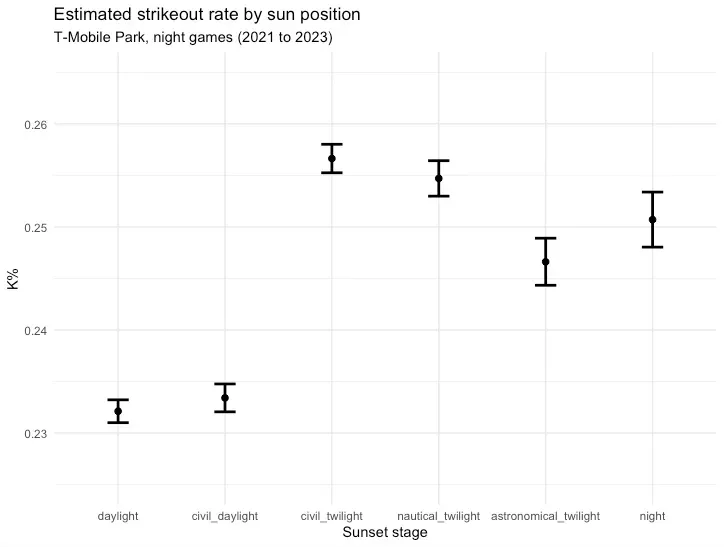
Before sunset, the estimated strikeout rate is about 23.2%. If we assume this is the true rate for T-Mobile Park, then we can attribute about 102 extra strikeouts each year to the position of the sun. Here’s the strikeout park factor in this scenario:
- 100 * [.232 / .228] = 101
T-Mobile Park goes from MLB’s most notorious strikeout haven to just about neutral.
Napkin math
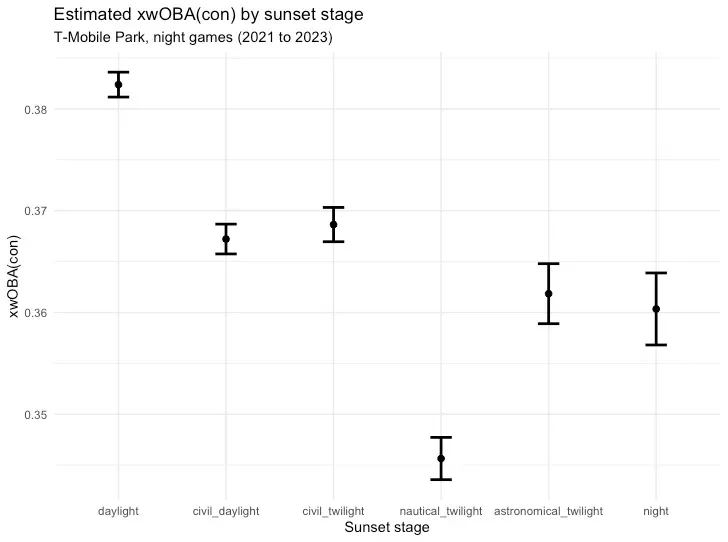
If sunset can turn a swing into a whiff, then it must have some influence on other bat-to-ball skills. We see that in the data, to some extent:
Quality of contact metrics are useful because they’re calculated at impact, which eliminates most sources of environmental bias (weather, field dimensions, etc). That’s why xStats and their components are sometimes referred to as “true talent” metrics. By eliminating noise found in results, we learn something inherent about a player, team, or (perhaps) stadium.
Now, we do expect climate to suppress some hits and runs at T-Mobile Park. Seattle is the coldest city in MLB, which reduces the distance a batted ball travels on average. Seattle ranks 23rd over the last four years in relative carry distance and has an average wOBA-xwOBA on batted balls of -.011 (which also ranks 23rd). So while the marine layer might not explain the underlying performance split in Seattle, it does explain why batted balls tend to die at the warning track.
OK, let’s say these models work well enough and the “true” performance levels at T-Mobile Park are what we observe before sunset:
23.2% strikeout rate
.376 xwOBA(con)
-.011 wOBA(con)-xwOBA(con)
Plate discipline and other ancillary rates remain unchanged
Under these conditions, the Mariners wOBA would jump from .295 to .309. Their park factor would jump from 92 to 97. Without the effect observed at sunset, T-Mobile Park performs in line with other cool, coastal venues.
The marine liar
There’s one important lie of omission here.
Weather changes pitch movement, which means it can (in theory) change the “true talent” baseline at each stadium. I found that whiffs at T-Mobile Park are influenced by some combination of temperature, humidity, air pressure, and wind. But these relationships are non-linear, making it difficult to isolate the full effect of climate on pitch quality.
I tried to estimate the impact of Seattle’s climate using a decomposition tool (from the world labor economics) known as DFL reweighting. Basically, DFL presents a counterfactual that asks, “What would performance at T-Mobile Park look like if it had the weather of all other parks?”
I found that about 20% of T-Mobile Park’s whiff rate (relative to other stadiums) can be explained by its distribution of weather variables—i.e., some of the “true talent” dip in Seattle is created by climate, but most of it is not.
I think 20% sounds about right. Yes, Seattle is the coldest city in MLB on average, but it ranks more favorably by other environmental factors. Seattle summers aren’t an outlier, and we shouldn’t expect Seattle weather to create outlier performance. In fact, DFL suggests parks in this sample shared about 80% of their weather characteristics. Weather changes pitch movement, but that applies everywhere to some degree.
Now, it’s tough to disentangle the sun from the weather, but these ideas don’t have to be mutually exclusive. If something about the stadium makes it harder to see, then even a modest increase in pitch movement could compound the effect. Again, there’s no reason to think pitches move significantly more in Seattle than they do in San Francisco or Oakland or Los Angeles. But this extra movement could matter more in Seattle, if there’s a vision issue.
And in case it’s not clear, after incorporating weather data into the models, the position of the sun remained a reliable indicator of performance across multiple models.
So let’s reassess. T-Mobile Park’s park factor is based on a discrepancy of .024 points of wOBA. If these estimates are reasonable, we can spread the blame like so:
The sun (or lighting) effect is worth about .011 points of wOBA, or about ~50% of the park factor;
The climate effect on batted balls is worth about .008 points of wOBA, or about one third of the park factor;
The climate effect on pitch movement is worth about .003 points of wOBA, or about ~10% of the park factor; and
About .002 points of wOBA (call it 10%) remains unexplained.
If you want to capture the park factor in a graph, I think this is it:
--