The shape of baseball
There’s a time and a place for baseball.
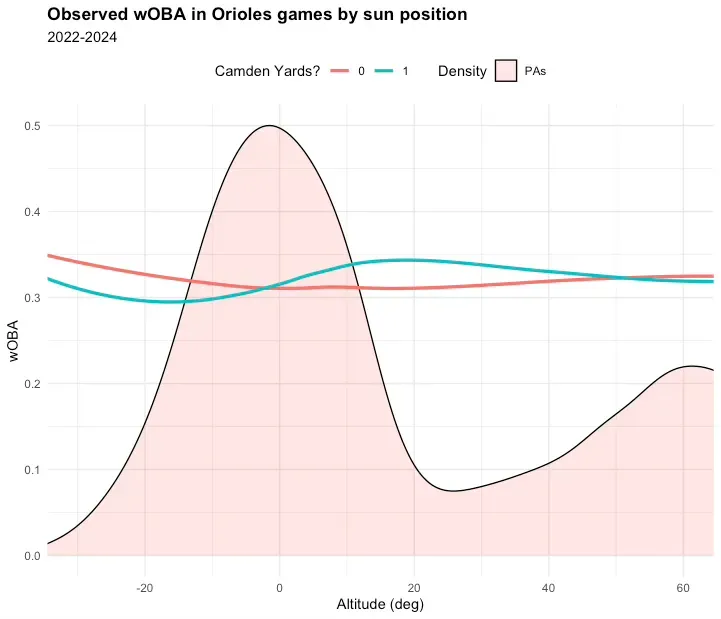
Camden Yards is a neutral park. There’s some particulars with the fence in left field, and it’s more neutral for some than for others, but Camden Yards is not an “extreme environment” like Coors Field or T-Mobile Park.
But it’s not neutral all the time. The plot below shows wOBA in Orioles games from 2022 through 2024. Early in the afternoon, Camden Yards is neutral. As dinner time approaches, it becomes more batter friendly. And then around sunset, it becomes more pitcher friendly.
“Time” matters to baseball in two ways:
As time progresses within a game, offense goes up a bit then way down. Batters gain an advantage against the starting pitcher the more times they face, and then relievers come in and take the advantage back.
As sunset approaches, temperature goes down, air density goes up, and wind patterns change. The specifics and impact vary by location and time of year, but the point being the environment is not constant and neither is its influence on baseball.
These two ideas must collide in some meaningful way. Let’s look at a simple example. This is wOBA by inning in all games for all teams from 2021 to 2024, split by day and night:
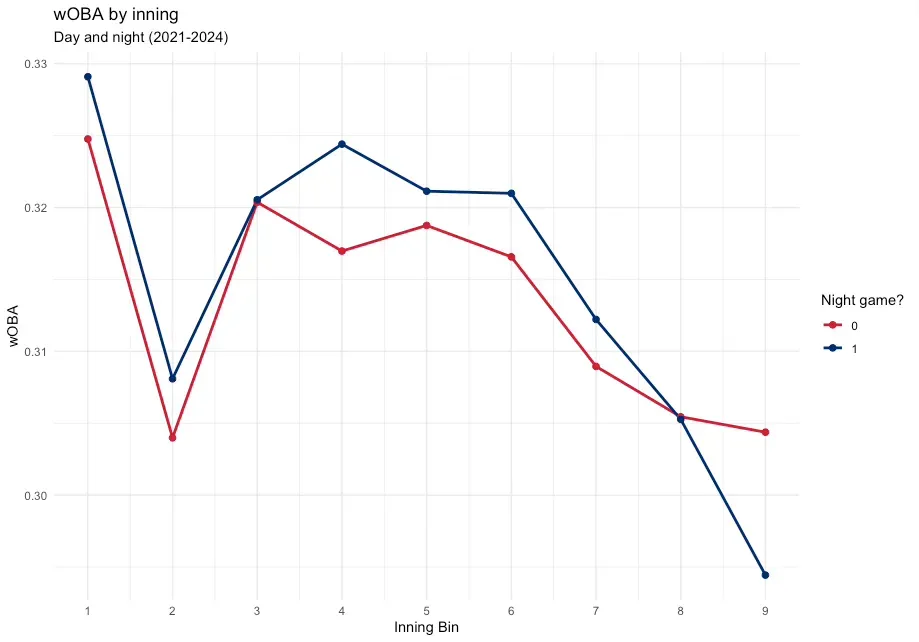
Focus on the rate of change over the last four innings. In day games, wOBA drops about 3% from inning 6 to inning 9, while wOBA in night games drops about 8%. If the shape of baseball can change this much between the two broadest possible environments, then there must be a range of shapes within.
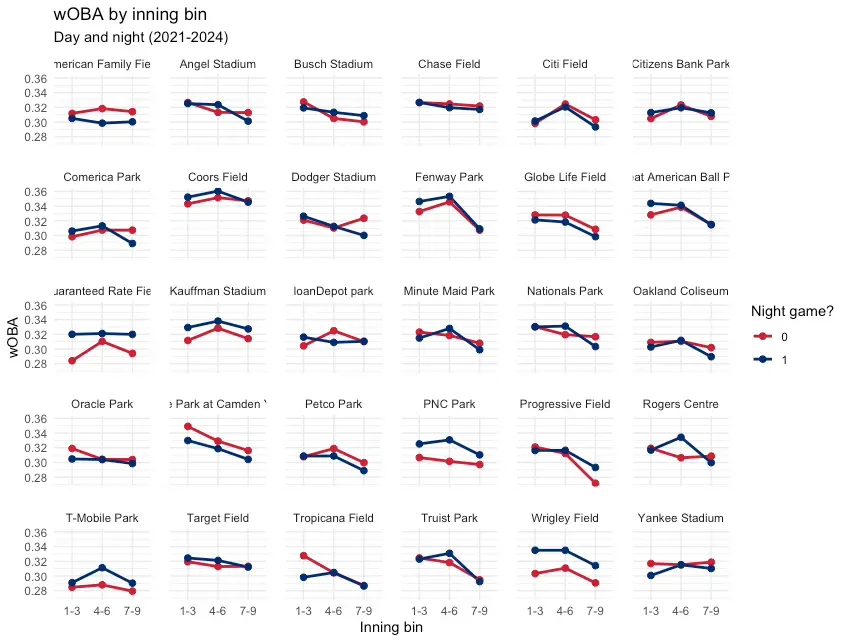
Let’s split all stadiums up by day and night, and bin wOBA at every three innings. Note that night games are defined (by me) as everything after 6 p.m. local time, which works fine for some venues but less fine for others. And yeah, many stadiums have some type of night-and-day split:
I think what I’m really getting at is how does the run environment change over the course of a day—i.e., what is the optimal time to play at each venue. One way to model this is with “time until to sunset,” or elapsed time from negative to positive in minutes, where sunset equals zero. I think elapsed time is more interpretable than direct sun positions, and anchoring time in a day to sunset seems more accurate than using normative time. (My thought being 7 p.m. means something different in April than August, whereas sunset would seem to reflect a meaningful waypoint in any day, regardless of the month.)
Below is modeled wOBA and xwOBA plotted over the course of the average day at each venue. It’s not perfect, but it’s a starting point:
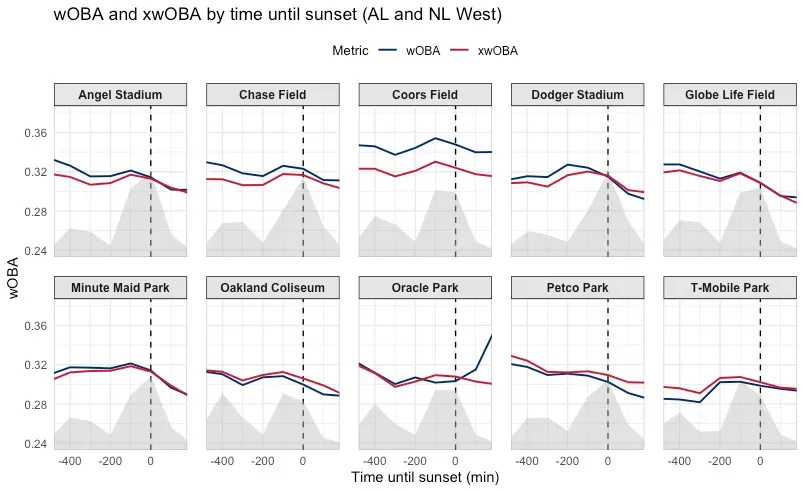
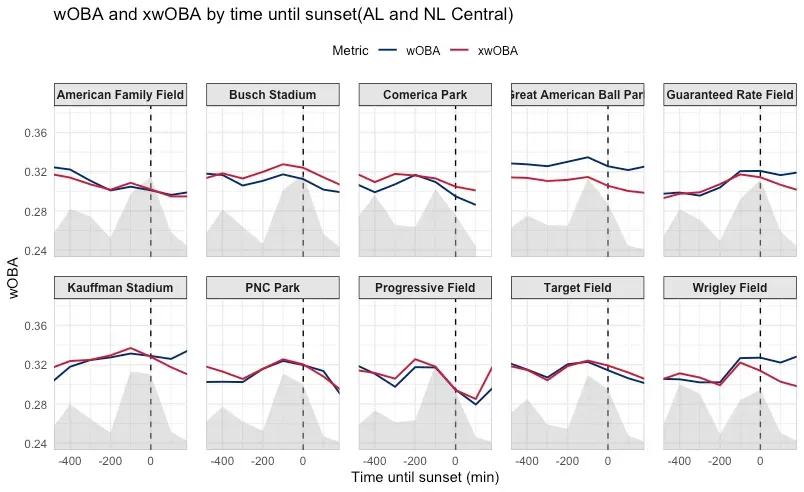
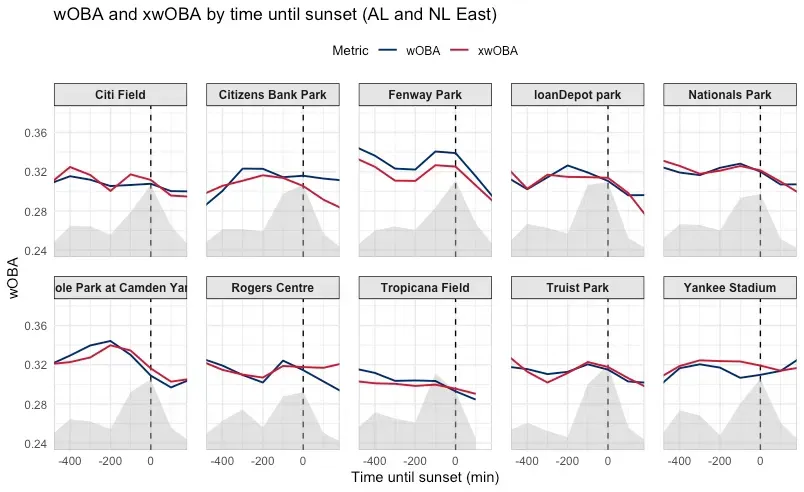
The challenge in doing something like this is dealing with all the asymmetric goo that exists within and between stadiums. Start times are all over the place and tend to change with the month. And the sun sets at different times (and at different rates) depending on where you’re at on the globe. There’s also the mushy middle portion of the day where there isn’t much data, making it difficult to distinguish the end of day games and start of night games.
To be clear, I’m not trying to recreate park factors here. They already do their job, and I don’t think it’s practical or necessary to get more granular. But I’ve always thought of park factors as this linear, graspable thing, where performance shifts symmetrically toward a single baseline. That doesn’t seem to be the case, and there must be some consequence.
What I’m ultimately after here is whether there’s significant runs gained or lost through the schedule itself. The plots above are a few examples of how I’m thinking about that question, but they’re just shapes for now, so there’s work to be done.
--